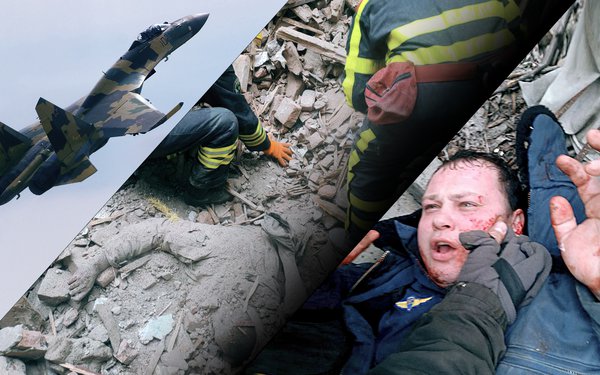
Mass murder on the Zhytomyr highway: map, chronology and investigation of Russian war crimes
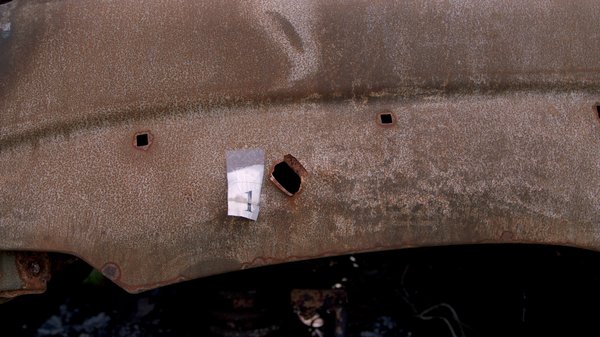
"We must recover the name of every personwho suffered from war crimes.Because a human being is not a number,"human rights activist Oleksandra Matviichuk.Dmytrivka is a small village just a few kilometres north of the Zhytomyr highway that connects Kyiv to Chop, a town near the Hungarian border. It’s the site of a dumping ground for cars that Russians shot and burned during the siege of Kyiv. It is one of dozens of dumps in the Kyiv region."After the de-occupation, about fifty cars were brought to Dmytrivka," say operatives of the Main Directorate of the National Police of Ukraine in the Autonomous Republic of Crimea and the city of Sevastopol (Ukraine has retained law enforcement agencies that worked in the territories that are now temporarily occupied — ed.)