In Ukraine, there are about 20,000 fires on arable land yearly
In Ukraine, people love to put things to the fire, and they rev in burning staff. Not only leaves and rubbish are burned, but also reeds, stubble, and grass. They are burned in such a way that sometimes forests also catch fire. In addition, more and more accidental wildfires occur every year due to droughts. As a result, we have the largest number of fires among all neighboring countries. Check out our interactive visualization to see what these fires look like.
Читати українською.
The fire kills animals, insects, and bacteria, it destroys black soils. Millions of tons of carbon dioxide and other harmful gasses from fires worsen the air we breathe.
On average, more than 30,000 fires per year are observed from space in Ukraine. If one burns leaves in one’s yard, the satellite's infrared sensor will not see it. These are actual fires when the flames spread over large areas. For comparison: in Romania there are four times fewer fires; in Poland, thirty times fewer. It can be argued that these countries have different areas, but even if you count the number of fires per unit of arable land (see the number of fires for each day below), Ukraine will still be the champion with a quarter more fires than in Romania, and still, ten times more than in Poland.
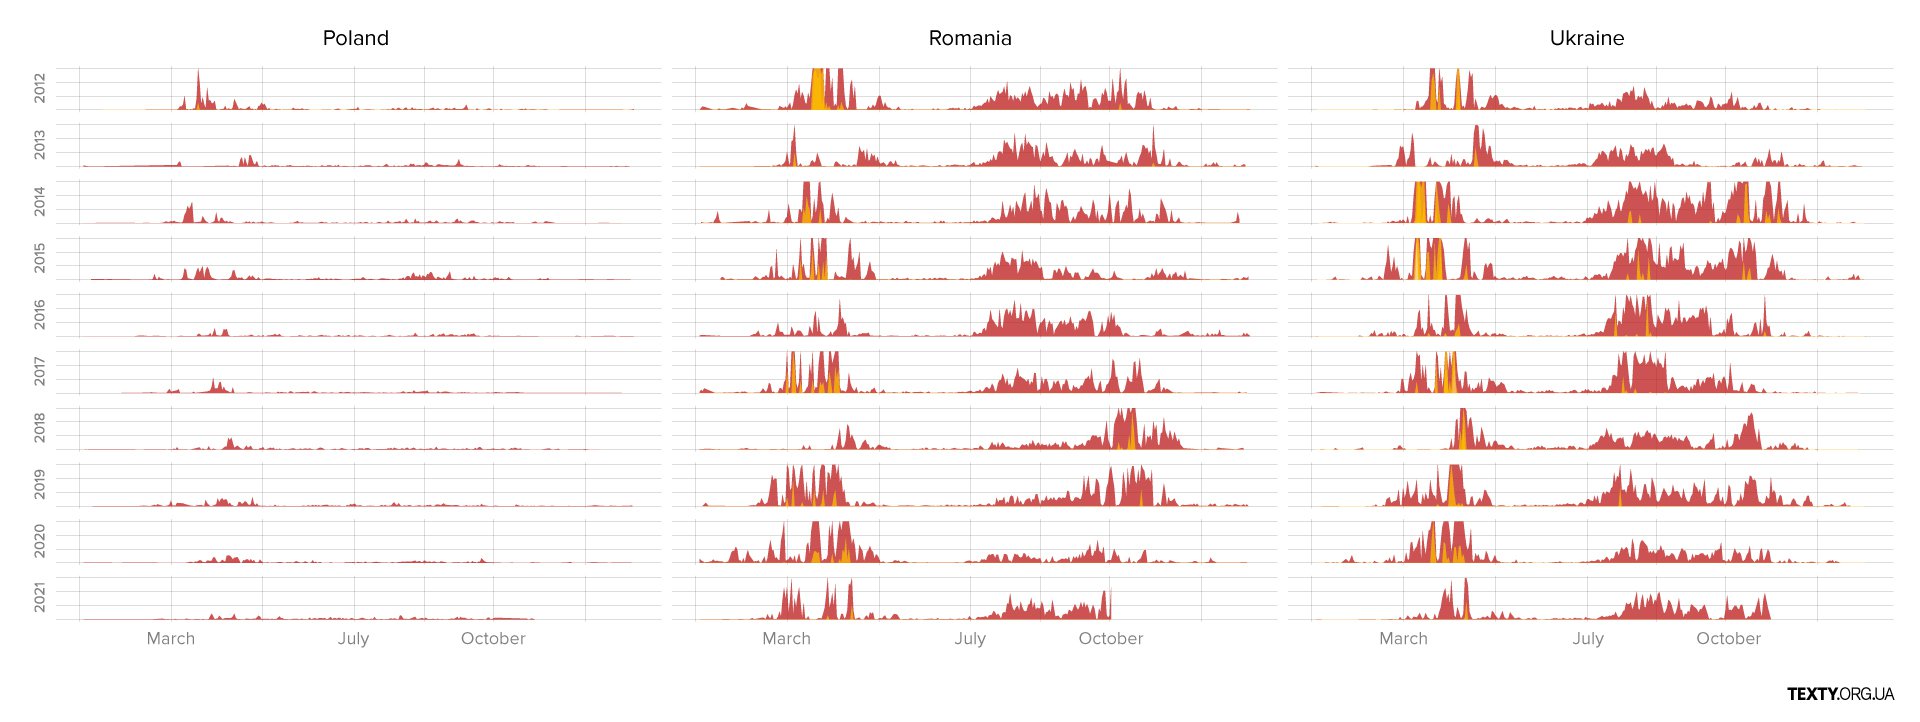
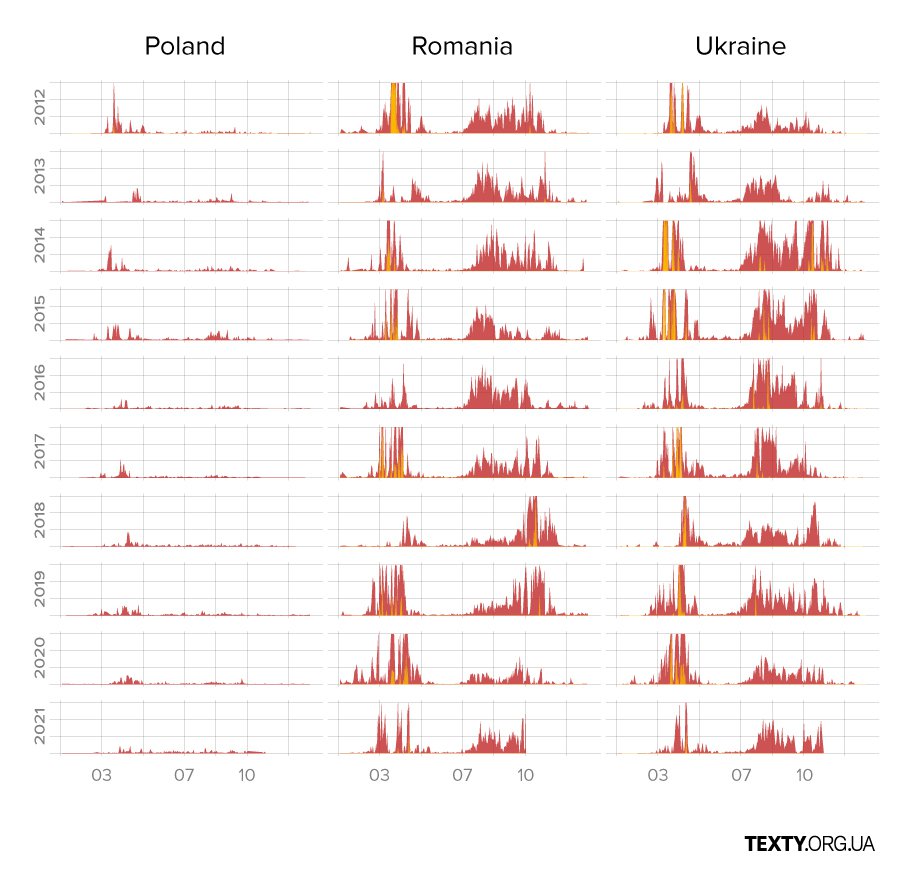
"Ukraine is the leader in the number of fires on agricultural land in Eastern Europe", said Serhiy Zibtsev, director of the Regional Eastern European Fire Monitoring Center. "Burning is banned in the European Union, and so it is in Ukraine, but no one follows the law here." It is unlikely that the doubling of fines introduced in early 2021 will help. This year, the number of fires in the spring decreased, but primarily due to the fact that after the winter there was a lot of moisture.
On the maps below you can once again see that there are two periods with the largest number of fire outbreaks: March through April, and then July through October. In the spring, fires mostly break out on uncultivated land, where there are dry wild plants. This happens in almost all regions except in the south. In summer and autumn, the vast majority of fires occur in the fields.
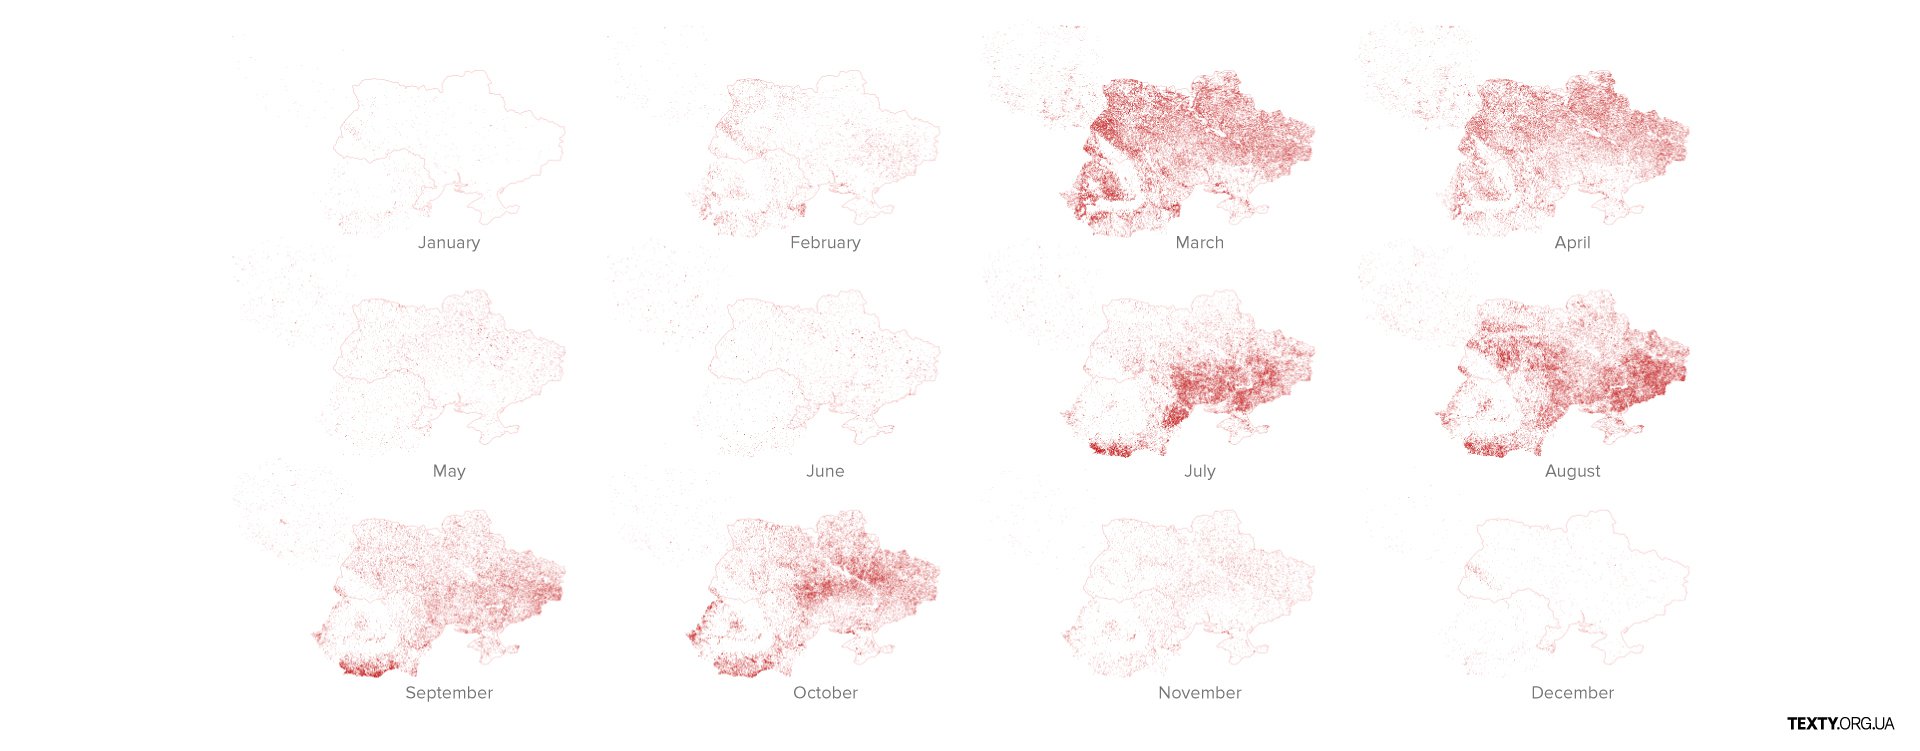
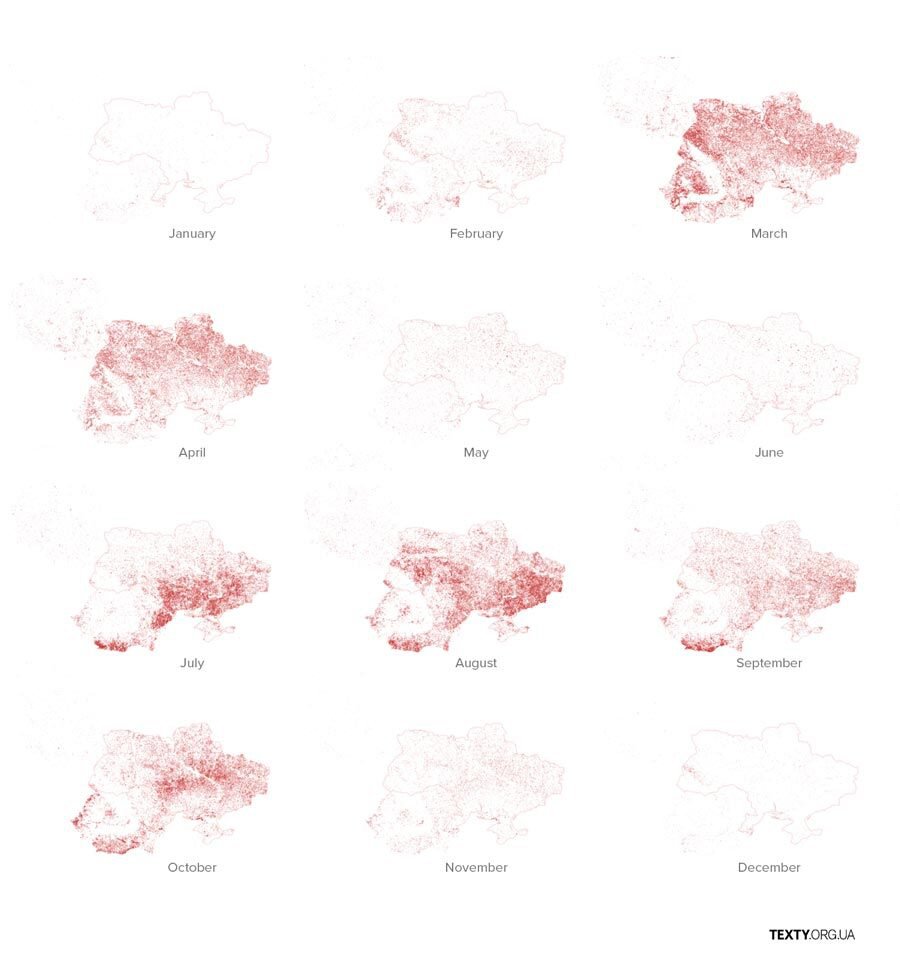
Satellite images below show that many such fires are created intentionally (fires appear simultaneously in many parts of the field). Farmers who burn stubble are involved in targeted arson. You can also see the burning of old grass in pastures and reeds in floodplains (the latter is mostly due to fishermen and hunters).
As a part of usual routine, after harvesting one needs to carry out cultivation, i.e. grinding and mixing stubble with the top layer of soil with a disc plow. Due to this, crushed and eventually rotted plant remnants will increase fertility.
Instead, some farmers simply burn stubble, despite possible fines and sanctions. To justify this, they say that a lot of fuel is spent on cultivation. At the same time, although they save on fuel, farmers are "shooting themselves in the foot", as such arson burns humus, destroys the ecosystem, and reduces overall soil fertility. In fact, this method is guaranteed to quickly kill fertile black soils. In addition, these fires can often spread to nearby forests or settlements. And they are a direct threat to human life.
What is the harm of burning fields?
In addition to the fact that fire reduces future yields (by destroying fertile black soils), another component is the release into the atmosphere of hazardous dust, harmful and "greenhouse" gasses, especially CO2, carbon dioxide.
One can make a quick and very approximate calculation of the lower emission limit of this gas in our case. In total, arable land has an average of about 20,000 fires a year (July through October). Their area averages about 1/4 of a square kilometer, as seen in many photos. Thus, the total area of fires will be ~ 500,000 hectares. One hectare of wheat yields about 5 tons of straw, and about one-fifth remains as stubble, i.e. we’re getting at 1 ton per hectare. Combustion of 1 ton of straw gives approximately 1.5 tons of CO2 (oxygen from the atmosphere joins the carbon in the straw). We can thus multiply 500 thousand hectares by 1.5 tons of emissions and get 750 thousand tons of CO2 only from field fires (recall, this is the lowest estimate). This value is approximately equal to all emissions from all thermal power plants operating in Ukraine.
Which other countries have a similar problem?
For example, India, especially in the northern states. In Punjab, for example, it is forbidden to burn stubble, but people continue to do so out of habit and in order to save money. As a result, soil yields are constantly declining, despite the constant use of fertilizers. The government is trying to fight burning the fields, but due to the unpopularity of such measures, the fight is very sluggish. The situation with both air quality and soil fertility is deteriorating every year.
Photos of the fires
In order to clearly show the huge number of fires, we have created a program that automatically finds and shows satellite photos of places on fire (read the methodology at the end of this article). A selection of such photos will appear on the page for each week you choose in the interactive visualization. Over time, the program will add new fires. We processed each satellite photo using an algorithm that adds fire to the site (red and orange pixels in the photo were added during processing).
In addition to images of fire and smoke, you can also see the completely scorched, blacker areas of the land. Important note! Only about one percent of all fires are captured in photographs, as the Sentinel-2 satellites capture any given area only once every five days, and in many cases it is impossible to take a good picture due to heavy clouds.
The visualization currently covers the years 2018-2021.
The chart below shows the number of fires by week. The brighter the color, the more fires.
Click on the image to enlarge it and see the coordinates of the fire on the Open Street Map.
The graph below shows the number of fires by week. The brighter the color, the more fires.
Click on the image to enlarge it and see the coordinates of the fire on the Open Street Map..
Number of fires
for the selected week:
Number of fires:
no images
loading

The data we used
We obtain data about the fires using the FIRMS service, which uses the results of monitoring the Earth surface by NASA / NOAA satellites. The satellites fly over every point on the Earth surface twice a day, and their infrared sensors can detect heat sources in an area of about 400 by 400 meters.
After receiving the data, we group the points with fire and select only clusters larger than a certain size in order to cut off minor / accidental heat sources and sensor errors. We also delete those heat sources in industrial areas which are present there almost constantly. We use the coordinates of each selected cluster as the coordinates of the fire, along with its date. You can see the number and location of such groups of clusters of fires in the first two visualizations of this project.
After that, knowing the coordinates of the fires, our program tries to find and download a photo for this area taken at the right time. To do this, we use Sentinel-2 satellite images from the European Space Agency, which photograph each point of the planet once every five days, with a maximum resolution of 10 meters per pixel. In many cases, the time of passage of satellites and the time of the fire do not coincide, or the images are very cloudy and nothing can be seen. Therefore, only a very small percentage of fires (about one percent of all cases) can be found in satellite images.
If the needed photo is available, we process it with a special algorithm to "highlight" the areas with flames in the pictures. We adapted it for our needs, see example on github by one of the authors. In the original photos there is no such zone of flame as you can see in our visualization. We use this visual exxageration in order to quickly find the fire in the picture. However, the zone of flame, which is added by the algorithm, clearly corresponds to the places where the fire occurs (this can be seen in the pictures).
How is this possible? The fact is that Sentinel-2 satellites return data not only in the ranges of red, green, and blue channels (from which the usual optical image is created). In total, these satellites collect data in 13 different bands at the appropriate frequencies of electromagnetic radiation, in particular in two SWIR bands (shortwave infrared radiation). It is these two bands which show areas with high temperatures in the picture. And they give the necessary information to "paint" the flame.